#include <Profiler.h>
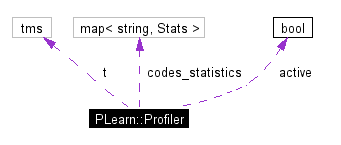
Collaboration diagram for PLearn::Profiler:

Static Public Member Functions | |
| void | activate () |
| void | disactivate () |
| void | start (const string &name_of_piece_of_code) |
| start recording time for named piece of code | |
| void | end (const string &name_of_piece_of_code) |
| end recording time for named piece of code, and increment frequency of occurence and total duration of this piece of code. | |
| void | report (ostream &out) |
| output a report on the output stream, giving the statistics recorded for each of the named pieces of codes. | |
Static Protected Attributes | |
| map< string, Stats > | codes_statistics |
| tms | t |
| bool | active = false |
Profiler::start("name_of_piece_of_code"); ... Profiler::end("name_of_piece_of_code");
A static field of Profiler is used to maintain the statistics of occurence and durations for each piece of code. Calls to start/end for the same name cannot be nested.
Before the above calls, usually in the main program, the user must call
and after all the above calls, a report for all such pieces of code can then be obtained by calling
on an output stream.
This code is based on statistical averaging (using the C "times" function) because the individual measurements of elapsed time with times are too coarse (e.g. 100th of a second).
Definition at line 89 of file Profiler.h.
|
|
Definition at line 106 of file Profiler.h. References active. |
|
|
Definition at line 107 of file Profiler.h. References active. |
|
|
end recording time for named piece of code, and increment frequency of occurence and total duration of this piece of code.
Definition at line 81 of file Profiler.cc. References active, codes_statistics, PLearn::Profiler::Stats::frequency_of_occurence, PLearn::Profiler::Stats::on_going, PLERROR, PLWARNING, t, PLearn::Profiler::Stats::time_of_last_start, PLearn::times(), and PLearn::Profiler::Stats::total_duration. Referenced by report(). |
|
|
output a report on the output stream, giving the statistics recorded for each of the named pieces of codes.
Definition at line 107 of file Profiler.cc. References codes_statistics, end(), PLearn::endl(), PLearn::Profiler::Stats::frequency_of_occurence, and PLearn::Profiler::Stats::total_duration. |
|
|
start recording time for named piece of code
Definition at line 52 of file Profiler.cc. References PLearn::Profiler::Stats::on_going, PLERROR, PLearn::Profiler::Stats::time_of_last_start, and PLearn::times(). |
|
|
Definition at line 48 of file Profiler.cc. Referenced by activate(), disactivate(), and end(). |
|
|
Definition at line 46 of file Profiler.cc. |
|
|
Definition at line 131 of file Profiler.h. Referenced by end(). |
 1.3.7
1.3.7